|
|
|
| |||||||||||||||||||||||||
|
|
|
Supply Tax Cuts and the Truth About
|
||||||||||||||||||||||||||||||||||||||||||||||||||||||||||||||||||||||||||||||||||||||||||||||||||||||||||||||||||||||||||||||||||||||||||||||||||||||||||||||||||||||||||||||||||||||||||||||||||||||||||||||||||||||||||||||||||||||||||||||||||||||||||||||||||||||||||||||||||||||||||||||||||||||||||||||||||||||||||||||||||||||||||||||||||||||||||||||||||||||||||||||||||||||||||||||||||||||||||||||||||||||||||||||||||||||||||||||||||||||||||||||||||||||||||||||||||||||||||||||||||||||||||||||||||||||||||||||||||||||||||||||||||||||||||||||||||||||||||||||||||||||||||||||||||||||||||||||||||||||||||||||||||||||||||||||||||||||||||||||||||||||||||||||||||||||||||||||||||||||||||||||||||||||||||||||||||||||||||||||||||||||||||||||||||||||||||||||||||||||||||||||||||||||||||||||||||||||||||||||||||||||||||||||||||||||||||||||
| Table 1 The Real Reagan Economic Record | |||||||
| Start of Presidency to End of Presidency | One-Year Policy Lag | ||||||
| Pre-Reagan | Reagan | Post-Reagan | Pre-Reagan | Reagan | Post-Reagan | ||
| 1973-80 | 1980-88 | 1988-95 | 1974-81 | 1981-89 | 1989-95 | ||
| Annual Percentage Change | |||||||
| Real GDP (chained 1992 dollars) | 2.4 | 3.1 | 2.0 | 2.8 | 3.2 | 2.1 | |
| Real GDP (chained 1992 dollars),per member of the adult working-age population* | 0.5 | 1.7 | 1.1 | 0.9 | 1.9 | 0.8 | |
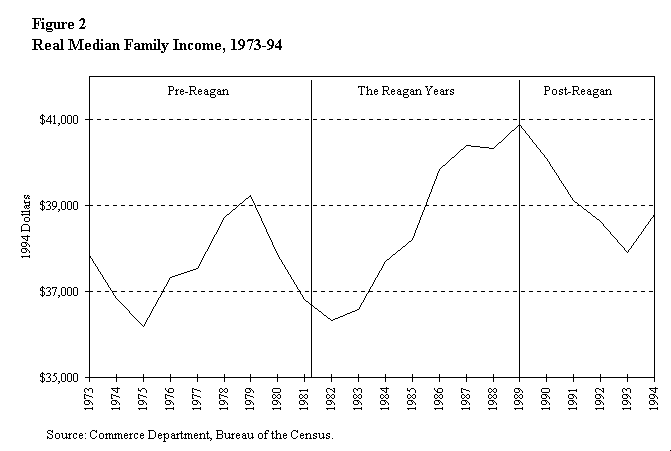
| Real median family income | 0.0 | 0.8 | -0.3 | 0.0 | 1.4 | -0.6 | |
| Total civilian employment, per member of the adultworking-age population* | 0.3 | 0.5 | 0.2 | 0.2 | 0.7 | 0.1 | |
| Total hours worked, business sector, per member of the adult working-age population* | -0.5 | 0.5 | 0.2 | -0.5 | 0.8 | 0.0 | |
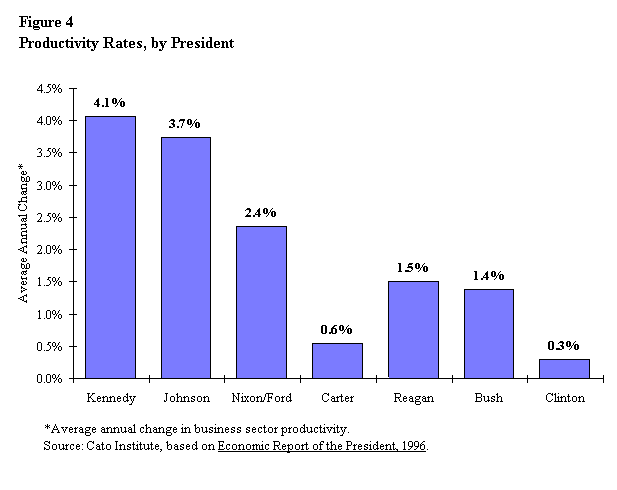
| Productivity (business sector output per hour) | 1.2 | 1.5 | 1.1 | 1.6 | 1.3 | 1.1 | |
| Annual Percentage Point Change | |||||||
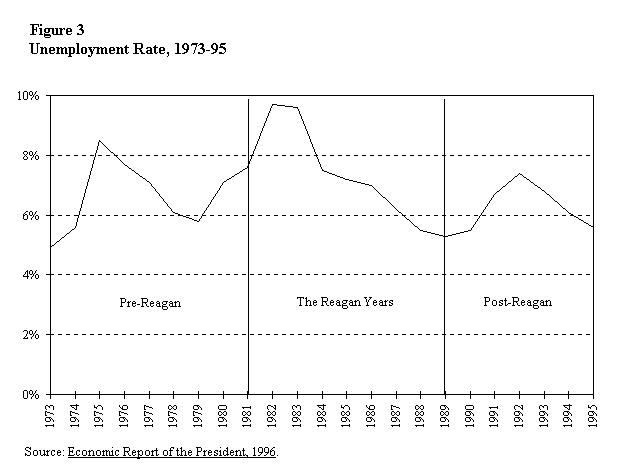
| Unemployment rate | 0.3 | -0.2 | 0.0 | 0.2 | -0.3 | 0.0 | |
| Inflation rate (change in GDP chain-type price index) | 0.4 | -0.8 | -0.2 | -0.2 | -0.5 | -0.3 | |
| Long-term interest rate (corporate bonds, Moodys Aaa) | 0.6 | -0.3 | -0.3 | 0.8 | -0.6 | -0.3 | |
| Personal savings rate | -0.2 | -0.4 | 0.0 | 0.0 | -0.5 | -0.1 | |
Source: Cato Institute calculations, based on data from Economic Report of the President, 1996; and Department of Commerce. *Figures were divided by the working-age adult population (defined as those aged 20-64). | |||||||
The Reagan Fiscal Record
The fiscal record of the 1980s was much less impressive than the economic record. The major outcomes of Reagan's budgetary policies, as well as of the pre- and post-Reagan budgetary policies, are summarized in Table 2. Highlights are as follows:
| Table 2 Budget Trends before, during, and after the Reagan Years | ||||||||||
| Percentage Change | ||||||||||
| Pre-Reagan | Reagan | Post-Reagan | ||||||||
| FY1973 | FY1981 | FY1989 | FY1996 | 1973-81 | 1981-89 | 1989-96 | ||||
| Billions of 1987 Dollars | ||||||||||
| Total outlays | 620.3 | 867.7 | 1,057.2 | 1,170.5 | 39.9 | 21.8 | 10.7 | |||
| Defense | 197.2 | 198.2 | 285.9 | 197.0 | 0.5 | 44.2 | -31.1 | |||
| Domestic | 380.0 | 581.1 | 615.0 | 790.0 | 52.9 | 5.8 | 28.5 | |||
| Interest | 43.1 | 88.4 | 156.3 | 183.5 | 105.1 | 76.8 | 17.4 | |||
| Receipts | 582.7 | 766.6 | 916.2 | 1,062.1 | 31.6 | 19.5 | 15.9 | |||
| Individual income tax revenue | 260.7 | 365.8 | 412.2 | 469.6 | 40.3 | 12.7 | 13.9 | |||
| Deficit | 37.6 | 101.0 | 141.0 | 108.4 | 168.6 | 39.6 | -23.1 | |||
| Debt held by the public | 860.7 | 1,004.7 | 2,025.2 | 2,805.4 | 16.7 | 101.6 | 38.5 | |||
| GDP (chain-weighted 1992 $)* | 3,902.3 | 4,724.9 | 6,060.4 | 6,742.9 | 21.1 | 28.3 | 11.3 | |||
| Percentage of GDP | ||||||||||
| Total outlays | 19.3 | 22.9 | 22.1 | 21.4 | 3.6 | -0.8 | -0.7 | |||
| Defense | 6.0 | 5.3 | 5.9 | 3.6 | -0.7 | 0.6 | -2.3 | |||
| Domestic | 11.9 | 15.3 | 12.9 | 14.5 | 3.4 | -2.4 | 1.6 | |||
| Interest | 1.4 | 2.3 | 3.3 | 3.3 | 0.9 | 1.0 | 0.0 | |||
| Receipts | 18.1 | 20.2 | 19.2 | 19.4 | 2.1 | -1.0 | 0.2 | |||
| Individual income tax revenue | 8.1 | 9.6 | 8.6 | 8.6 | 1.5 | -1.0 | 0.0 | |||
| Deficit | 1.2 | 2.7 | 2.9 | 2.0 | 1.5 | 0.2 | -0.9 | |||
| Debt held by the public | 26.8 | 26.5 | 42.3 | 51.4 | -0.3 | 15.8 | 9.1 | |||
| Table 3 Growth of Domestic Spending, by President | ||
| Annual Percentage Annual Increase in Billions |
President Increase of 1995 dollars | |
| Truman | 5.5 | 5 |
| Eisenhower | 7.5 | 12 |
| Kennedy/Johnson | 8.0 | 21 |
| Nixon/Ford | 8.5 | 42 |
| Carter | 3.5 | 34 |
| Reagan | 1.0 | 17 |
| Bush | 4.5* | 29 |
| Clinton | 3.0* | 23 |
Source: Historical Tables, Budget of the United States Government, Fiscal Year 1996.
*Includes nondefense spending in the defense budget.
The 1980s: Facts versus Fables
In this section we depart from the purely factual presentation of the economic and fiscal performance of the 1980s presented above and interpret what these data say about the Reagan years. We find in many cases that the historical evidence contradicts much of the most commonly cited conventional wisdom of the Reagan years. Specifically, there are 12 common fables about the 1980s that are at odds with the facts.
Fable 1: The Reagan Administration Relied on "Pie-in-the-Sky" Predictions That Tax Rate Cuts Would Pay for Themselves
Supply-siders predicted their tax cuts would pay for themselves. This was nonsense from day one, because the credible evidence overwhelmingly indicates that revenue feedbacks from tax cuts is 35 cents per dollar, at most. Are we really gullible enough to accept a free dinner while still suffering the indigestion from our "free" lunch? [23]
This is one of the great enduring myths of Reaganomics: that the White House relied on wild supply-side assumptions regarding the revenue impact of the tax cuts. The Reagan administration never assumed that the tax cuts would pay for themselves. In fact, "America's New Beginning: A Program for Economic Recovery," the White House budget plan released on February 18, 1981, included a table entitled "Direct Revenue Effects of Proposed Tax Reductions." [24] That table predicted a huge $700 billion revenue loss from the tax cuts through 1986, as shown in Table 4.
| Table 4
Reagan Administration's Scoring of the 1981 Tax Cut--Revenue Impact, in Billions of Dollars | ||||||
| 1981 | 1982 | 1983 | 1984 | 1985 | 1986 | 1981-86 |
| -8.8 | -53.9 | -100.0 | -148.1 | -185.7 | -221.7 | -718.2 |
Source: Office of the President, "America's New Beginning: A Program for Economic Recovery," February 18, 1981, p. 16.
Fable 2: The Reagan Tax Cuts "Caused" the Budget Deficit to Explode in the 1980s
Fifteen years ago, marginal tax rates and the progressivity of the tax system were dramatically reduced. Some suggested that these policies would so spur economic growth that tax revenue would actually increase. The outcome of that experiment is now a matter of record: not only did this response not occur, but the national debt quadrupled in the span of a dozen years. [25]
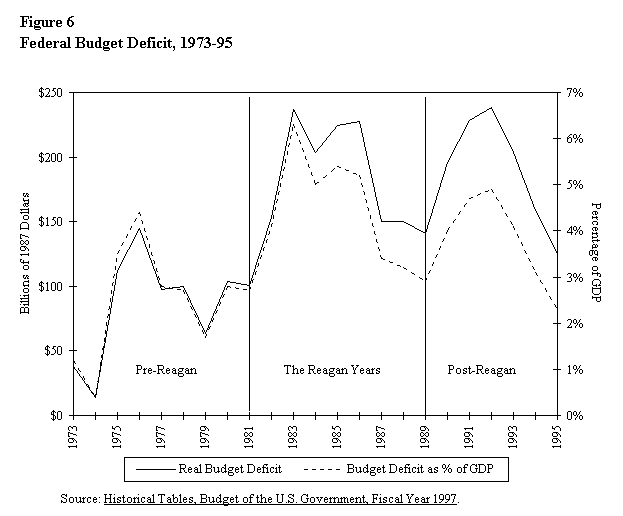
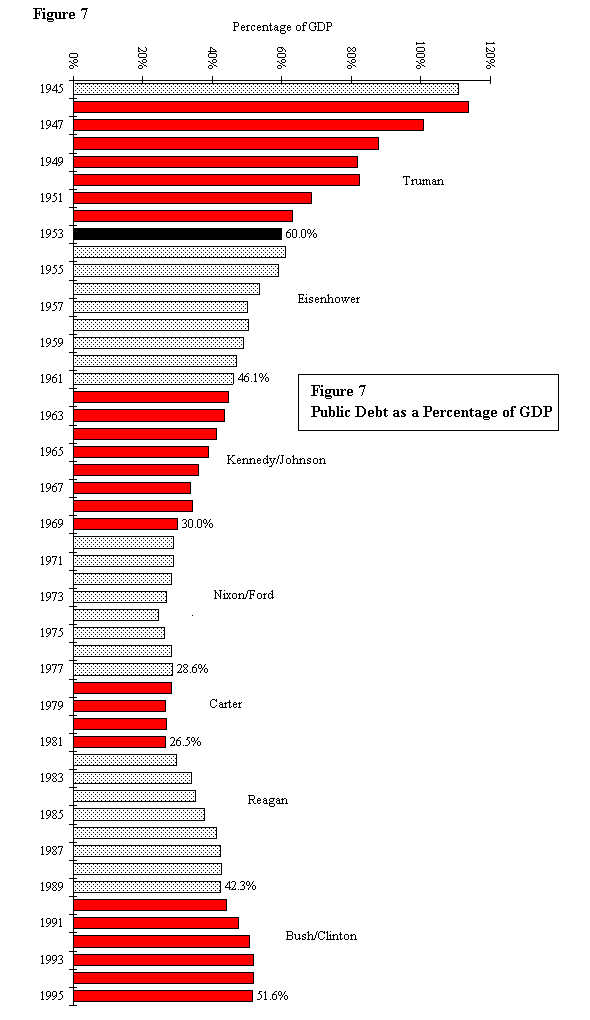
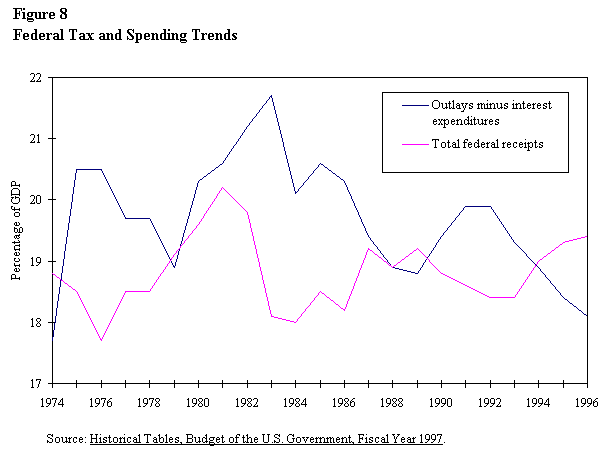
This is the most common and overly simplistic interpretation of the budgetary events of the 1980s. Further, it is factually untrue that the Reagan tax cuts were a major cause of the budget deficits of the 1980s and the "quadrupling" of the debt. (In the 1980s the real debt doubled; it did not quadruple.) Real federal revenues grew at a faster pace after the Reagan tax cuts than after the Bush and Clinton tax hikes. From 1982 to 1989, they expanded by 24.1 percent. Over a comparable seven-year period, 1990-97, a period that accounts for both the Bush and the Clinton tax increases, real federal revenues will have grown by 19.3 percent (see Table 5). The lesson of the 1980s and 1990s is consistent with the supply-side theory that there are behavioral and investment responses to changes in tax rates.
Figure 8 shows that, as a share of GDP, federal revenues fell from 20.2 percent in 1981 (the peak year for taxes as a share of GDP in the post-World War II period) to a low of 18.0 percent of GDP in 1984, and rose back up to 19.2 percent by 1989. This would suggest that the Reagan tax cuts were a small contributing factor to the increase in the budget deficit over the course of the 1980s. From 1950 to 1995, federal receipts have averaged 18.4 percent of GDP. Hence, throughout most of the Reagan years and clearly by the end, taxes as a share of national output were substantially above the postwar average.
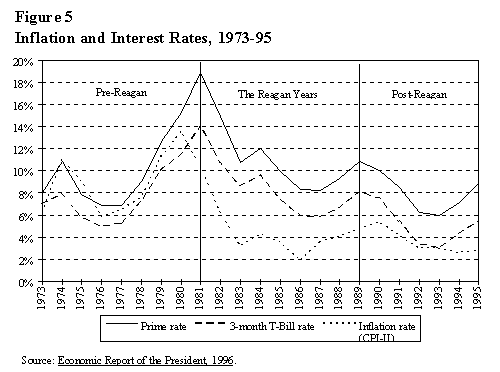
If the Reagan tax cut was not the major contributing factor to the increasing deficit in the 1980s, what was? There were two primary explanations: (1) a large and sustained defense build-up; and (2) the unexpected rapid decline in inflation and the recession in the early 1980s.
The Defense Buildup and the Deficit. Table 6 shows that the cumulative increase in defense spending from 1981 to 1989 ($806 billion) was larger than the entire cumulative increase in the budget deficit ($779 billion) in those years. That is, if defense spending had been held to the rate of inflation from 1981 to 1989, the total real deficit would have fallen in the 1980s rather than risen. It is also true that the decline in the military budget accounts for almost the entire fall in the deficit from 1988 to 1996. [26]
| Table 5 Reagan Tax Cuts vs. Bush-Clinton Tax Hikes: Overall Real Revenue Growth | |||||
| After Reagan Tax Cuts | After Bush-Clinton Tax Hikes | ||||
| Year | Total Revenue* | Percentage Change | Year | Total Revenue* | Percentage Change |
| 1982 | 738 | 1990 | 914 | ||
| 1983 | 684 | -7.3 | 1991 | 895 | -2.1 |
| 1984 | 730 | 6.7 | 1992 | 895 | 0.0 |
| 1985 | 777 | 6.4 | 1993 | 922 | 3.7 |
| 1986 | 790 | 1.7 | 1994 | 982 | 6.5 |
| 1987 | 854 | 8.1 | 1995 | 1,034 | 5.3 |
| 1988 | 877 | 2.7 | 1996 | 1,082 | 4.6** |
| 1989 | 916 | 4.4 | 1997 | 1,090 | 0.7** |
| Total | 24.1 | 19.3 | |||
Source: Historical Tables, Budget of the United States Government, Fiscal Year 1997.
*Billions of 1987 dollars.
**Congressional Budget Office, August
1996 revenue forecast.
| Table 6 Defense Spending and Deficits in the 1980s | ||||||
| As % of GDP | $ Billions | Buildup | ||||
| Year | Defense | Deficit | Defense | Deficit | Defense | Deficit |
| 1981 | 5.3 | 2.7 | 134 | 79 | ||
| 1982 | 5.9 | 4.1 | 158 | 128 | 24 | 49 |
| 1983 | 6.3 | 6.3 | 185 | 208 | 51 | 129 |
| 1984 | 6.2 | 5.0 | 210 | 185 | 76 | 106 |
| 1985 | 6.4 | 5.4 | 227 | 212 | 93 | 133 |
| 1986 | 6.5 | 5.2 | 253 | 221 | 119 | 142 |
| 1987 | 6.3 | 3.4 | 273 | 150 | 139 | 71 |
| 1988 | 6.0 | 3.2 | 282 | 155 | 148 | 76 |
| 1989 | 5.9 | 2.9 | 290 | 152 | 156 | 73 |
| Change 1981-89 |
0.2 | 0.6 | 156 | 73 | 806 | 779 |
Source: Historical Tables, Budget of the United States Government, Fiscal Year 1997.
If the entire accumulation of debt in the 1980s went to finance the Reagan defense build-up, the key policy question would shift to whether it was appropriate to borrow for those large military expenditures. Was the Reagan administration justified in paying for this one-time increase in "public investment" spending through debt rather than taxes? Or, put another way, was it appropriate to have asked our children and grandchildren to help defray the cost of defeating the Soviet menace?
The answer to that question rests to some extent on the issue of whether the defense build-up materially contributed to the collapse of the Soviet Union and, if so, on the discounted present value to our children and grandchildren of no longer having the "Evil Empire" imperiling the security of the planet. The figure could easily be in the trillions of dollars.
In any case, Reagan's critics were proven right when they said that the administration would not be able to cut tax rates, increase the defense budget, and balance the budget all at the same time.
The Fall in Inflation and the 1981-82 Recession. The unexpectedly steep decline in inflation in 1981 and 1982 contributed significantly to the rise in the deficit in the early 1980s. [27] When inflation falls sharply and unexpectedly, so too do nominal revenues while real expenditures rise sharply and unexpectedly. Both Reagan and Congress had approved spending increases for 1982-85 on the assumption, mostly due to erroneous inflation forecasts, that nominal GDP would be some $2.5 trillion higher than it was between 1981 and 1986. The abrupt reduction in inflation created an estimated $300-$400 billion spending windfall for defense and domestic programs. [28]
Fable 3: The Federal Reserve, Not Ronald Reagan, Deserves the Credit for Ending the 1970s Era of High Inflation
One man is more responsible for the political success of the Reagan presidency than any other, and his name is not Ronald Reagan. It is Paul Volcker, the man Jimmy Carter appointed as chairman of the Federal Reserve Board. A relatively stable currency has been the basis . . . for the economic boom of recent years. . . .
And Volcker did it. In October 1979 he persuaded his colleagues to starve inflation of the dollars it feeds on. President Reagan did little to help. In fact, his deficits worked against Volcker's efforts. [29]
The conquering of inflation in a very short time was primarily a result of tightening monetary policy under Federal Reserve Board chairman Paul Volcker. Volcker deserves high praise for the change in policy. But Reagan clearly warrants a large part of the credit for endorsing the overdue correction in Federal Reserve policy from the high-inflation 1970s. A major element of Reaganomics, in addition to the tax cuts, was sound money--a policy the nation had not followed since the late 1960s. The Federal Reserve's policy of sweating out inflation took place with the explicit approval of the Reagan administration, even though that policy contributed to the deep recession of 1981-82 and the unexpectedly large and immediate fall in inflation was a major factor in the budget deficit explosion in the early 1980s.
The Reagan-Volcker anti-inflation policy may seem noncontroversial today, but it is noteworthy that at the time the decisions were made, there was very little consensus about how to defeat inflation. [30] In 1980, for example, economist Paul Samuelson wrote that "two-digit price inflation is a distinct possibility for much of the decade of the 1980s." [31]He predicted an inflation rate from 1982 to 1987 of 9.4 percent a year. The Democratic party was endorsing a host of inflation-fighting measures that were economically wrongheaded and almost certain to fail. During the 1980 Democratic presidential primaries, Jimmy Carter's anti-inflation policy included credit controls and gas rationing while Ted Kennedy, his opponent, endorsed wage and price controls.
Most Keynesian economists had predicted that Reaganomics would make inflation worse, not better. Hobart Rowen of the Washington Post stated the conventional wisdom by arguing that the Kemp-Roth tax cuts would be "dangerously inflationary." [32] He added, "There is nothing in the [Reagan] fiscal program--in the view of those not addicted to supply-side theory--that works against inflation." James Tobin, a Nobel prize winner and an informal Clinton administration adviser, also had warned of the inflationary impact of Reagan's tax cuts and had called instead for "a five-year period of gradually declining wage-increase guide-posts."[33] The late Walter Heller, a Keynesian who had served as John Kennedy's chief economic adviser, summarized the conventional wisdom most succinctly in 1980: "The [Reagan] tax cut would simply overwhelm our existing productive capacity with a tidal wave of demand," thus accelerating inflation.[34]
Amazingly, even after inflation had fallen by more than half by late 1982, Reagan's skeptics believed the progress on prices was a temporary aberration. Economist Paul Krugman, now of Massachusetts Institute of Technology, and Larry Summers of the Clinton Treasury Department warned in November 1982 of a coming "inflation time bomb." "It is reasonable to expect a significant reacceleration of inflation in the near future," they wrote. "A significant portion of the slowing of consumer price inflation since 1980 does not represent a reduction in the underlying rate." [35]
Fable 4: Reagan Had Little to Do with Ending the Energy Crisis; He Was the Fortunate Beneficiary of the Demise of the Organization of Petroleum Exporting Countries
Luck was on Reagan's side in the 1980s. OPEC crumbled and world commodity prices fell.[36]
OPEC's demise clearly contributed to the end of high inflation in the 1980s. But luck is not what caused the downfall of OPEC. Reagan's first official act as president was, by executive order, to immediately terminate oil price controls, a policy that instantly reenergized America's domestic production and exploration of oil.
Moreover, the energy crisis in the 1970s was not purely a result of external factors beyond the control of politicians. With respect to dealing with OPEC, virtually every government energy policy in the 1970s--those under Nixon, Ford, and Carter-- exacerbated the energy crisis, from the windfall profits tax to energy price controls. Reagan hastened the end of the energy crisis by repealing all of these misguided policies.[37]
Fable 5: Clinton's Economic Record Has Outperformed Reagan's
Our economy is the soundest it's been in a generation.[38]
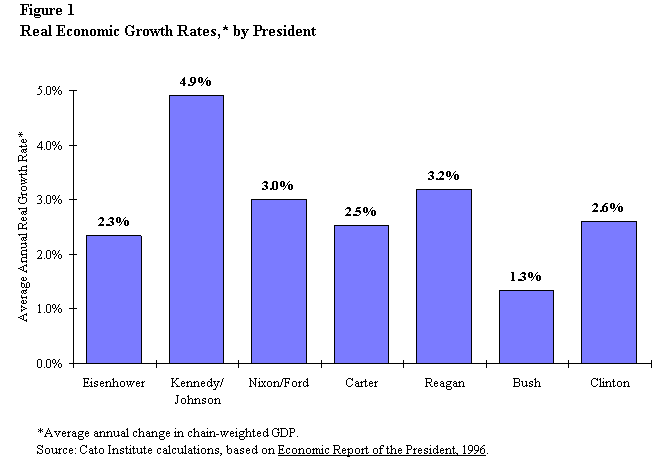
The growth rate under Clinton has been 2.7 percent, half a percent below the 3.2 percent growth rate under Reagan and a full percentage point below the 3.8 percent growth rate during the 1983-89 expansion. Standard government forecasts predict a 2-2.5 percent growth rate through the end of the decade. Yet, if even the high end of that forecast proves to be accurate, the 1990s will be the lowest economic growth decade since the Great Depression and the second lowest in the 20th century.
Fable 6: The 1980s Expansion Was a Classic Keynesian Economic Recovery Driven by the Stimulative Effects of High Deficits
Reagan's economic program actually amounted to the longest and most successful Keynesian recovery the world has yet seen. [39]
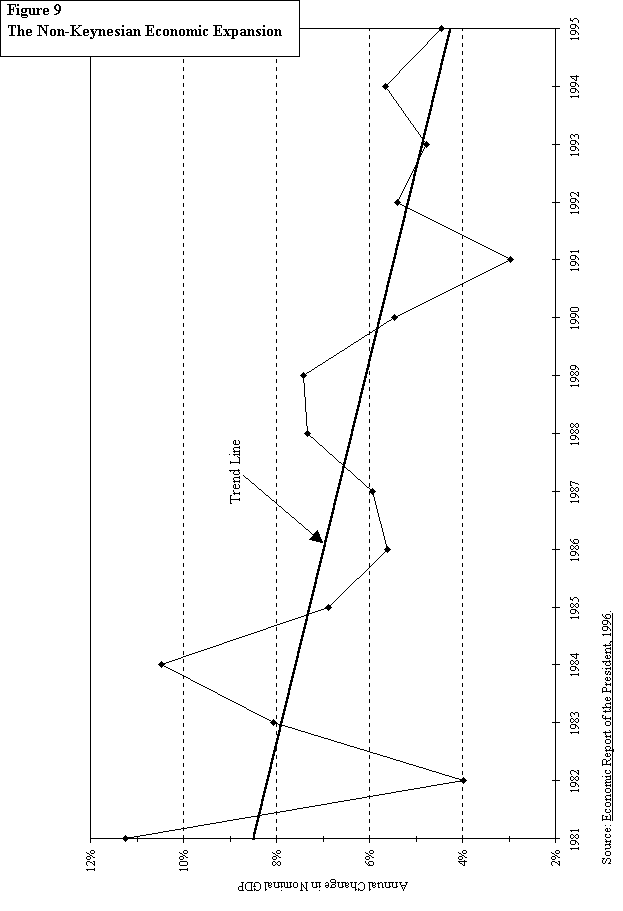
If the 1980s expansion had been a classic, demand-driven Keynesian recovery, nominal demand should have grown rapidly in the 1980s. However, as Figure 9 shows, over the course of the 1980s the rate of nominal demand growth fell.
The Keynesian explanation of the economic recovery in the 1980s is also fundamentally inconsistent with the sharp fall in inflation throughout that decade. If the recovery had been driven by a hike in the demand for goods and services rather than by a supply-side effect of greater output, inflation would have risen rather than fallen. But it did fall. This is why the near-universal predictions by Reagan's opponents from 1979 to 1981 of higher inflation from tax cuts proved to be entirely misguided.
Finally, if budget deficits are highly stimulative, the post-Reagan period of 1990-95 should have produced strong economic growth. The budget deficits of that period were very nearly of the same magnitude as the deficits of 1982-89 (4.2 percent of GDP versus 3.9 percent of GDP); in the 1980s, however, we had rapid growth and in the 1990s we have had anemic growth. The answer seems to be the supply-side effects of tax and regulatory reductions in the 1980s versus the tax hikes and reregulation in the 1990s.
Fable 7: The Robust Reagan Economic Expansion Was Only a Result of the Steep Economic Decline in the Early 1980s
Reagan's political adversaries maintain that the economy expanded rapidly from 1983 to 1989 only because of the underused resources from the severe recession of 1981-82. This interpretation of the 1980s expansion is contradicted by two facts. First, even taking into account the deep recession years of 1981-82, the economy grew at a faster rate over the entire Reagan period than it did over the Ford-Carter years and the Bush-Clinton years.
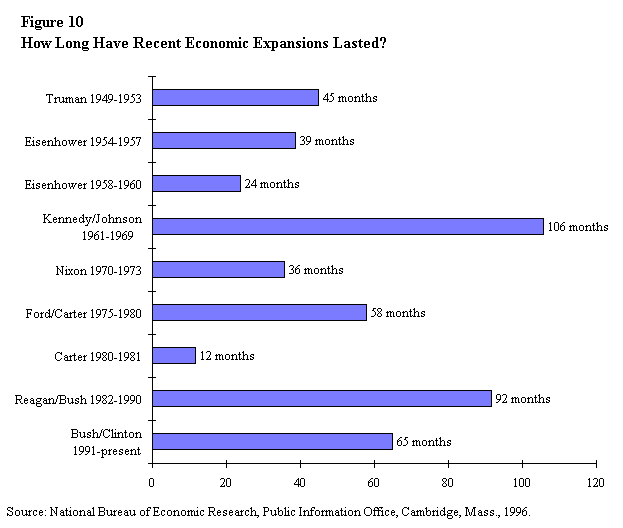
Second, the economic expansion of the 1980s was notable for not only its strength but also its length. Figure 10 demonstrates that the Reagan recovery lasted 92 months, making it the second longest uninterrupted economic expansion in the century--outlasted only by the 1961-69 boom.[40]
Fable 8: Bush and Clinton Inherited a Future of High and
Rising Deficits from Reagan
The supply-side turkey has come home to roost. [41]
It is a popular misconception that Presidents Bush and Clinton inherited large deficits "baked in the cake" from Reagan policies. When Reagan left the White House in January 1989, the fiscal outlook was expected to continue to improve rather than worsen. In that month, the CBO released its long-term forecast for the economy and the budget deficit.
Table 7 shows that the deficit was expected to continue to fall steadily to $110 billion and 1.5 percent of GDP by 1995.[42]These forecasts reflected in large part a continuation of the modest fiscal progress achieved during Reagan's second term. The CBO concluded that continued deficit reduction would occur even if Bush were to do nothing to improve the budget outlook and simply left fiscal policy on automatic pilot. In reality, the national debt was $622 billion higher than anticipated and as a share of GDP, the budget deficits were nearly 2 percentage points higher. Measured in real dollars, the 1990-94 period showed the worst five-year deficit performance in the post-World War II era. [43]
| Table 7 Deficits in the 1990s: Reagan Baseline vs. Actual Performance | ||||||
| CBO, 1989 | Actual | Difference | ||||
| Year | $ Billions | % GDP | $ Billions | % GDP | $ Billions | % GDP |
| 1990 | 141 | 2.6 | 121 | 4.0 | 80 | 1.4 |
| 1991 | 140 | 2.4 | 269 | 4.7 | 129 | 2.3 |
| 1992 | 135 | 2.2 | 290 | 4.9 | 155 | 2.7 |
| 1993 | 129 | 2.0 | 255 | 4.1 | 126 | 1.9 |
| 1994 | 122 | 1.7 | 203 | 3.1 | 81 | 1.4 |
| 1995 | 110* | 1.5* | 161 | 2.4 | 51 | 0.9 |
| Total | 777 | 1,399 | 622 | |||
| Total % GDP |
2.1 | 3.9 | 1.5 | |||
Source: Congressional Budget Office, "Economic and Budget Outlook," January 1989.
*1995 projections come from the CBO's March 1990 report.
Fable 9: Workers Had to Work Harder for Smaller Paychecks in the 1980s
Caught between the lawmakers in Washington and the dealmakers on Wall Street have been millions of American workers forced to move from jobs that once paid $15 an hour into jobs that now pay $7. [44]
Barlett and Steele never back up such anecdotal claims with any facts. Here they are: the correct way to measure changes in worker pay from one period to the next is not by examining wages alone, but by tallying the total compensation per hour--a measure that includes wages and benefits--paid to a worker. [45] Nonwage benefits have been an increasing share of total hourly worker compensation. In 1960, 9 percent of worker compensation was in the form of fringe benefits; in 1975, 16 percent of worker compensation was wage supplements; and by 1990, that percentage had risen to 20 percent. [46]So although it is true that average real wages have been falling over the past 20 years, real compensation has been generally rising. The average real wage in 1990 dollars fell from about $11.00 an hour in 1980 to about $10.00 in 1988, a 9 percent decline. But real compensation per hour rose from $15.00 per hour in 1981 to $16.50 an hour in 1988. [47]
Fable 10: In the 1980s the Rich Got Richer and the Poor Got Poorer
During the 1980s the bucket of liberty and economic freedom rose, while the bucket of income equality fell. Upper-tier Americans significantly expanded their share of national wealth, while low-income citizens lost ground. Reagan policies were critical to the shift. [48]
During the Reagan years, the total share of national income tilted toward the wealthiest Americans. From 1980 to 1988 the wealthiest 5 percent of Americans increased their share of total income from 16.5 to 18.3 while the poorest fifth saw their share fall from 4.2 to 3.8 percent. [49]
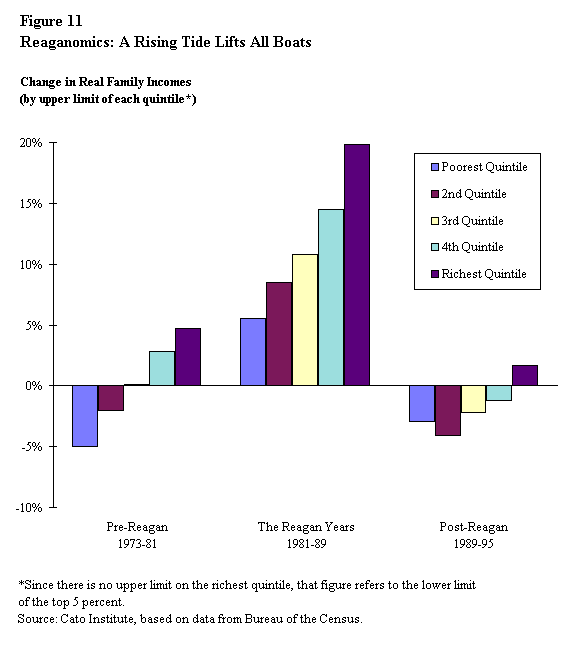
Yet it is not true that the gains by the wealthiest Americans came at the expense of low-income Americans. From 1981 to 1989, every income quintile--from the richest to the poorest--gained income according to the Census Bureau economic data (see Figure 11). [50] The reason the wealthiest Americans saw their share of total income rise is that they gained income at a faster pace than did the middle class and the poor. But Reaganomics did create a rising tide that lifted nearly all boats.
Table 8 shows that by 1989 there were 5.9 million more Americans whose salaries exceeded $50,000 a year than there were in 1981 (adjusting for inflation). Similarly, there were 2.5 million more Americans earning more than $75,000 a year, an 83 percent increase. And the number of Americans earning less than $10,000 a year fell by 3.4 million workers.
| Table 8 Workers' Incomes in the 1980s (millions of workers and billions of 1981 dollars) | |||
| Year | < $10,000 | > $50,000 | > $75,000 |
| 1981 | 66.0 | 9.9 | 3.0 |
| 1989 | 62.6 | 15.8 | 5.5 |
| Difference | -3.4 | 5.9 | 2.5 |
| % Change | -5% | 60% | 83% |
Source: Cato Institute calculations based on Bureau of the Census, U.S.
Statistical Abstract, 1996, p. 478, Table 740.
Note: Earning levels
are adjusted for inflation between 1981 and 1989.
The gains in incomes of all income groups is all the more
impressive when we examine data on income mobility. Tens of millions of
Americans moved up the income scale in the 1980s--an economic fact that is
obscured when only the static income quintile data from the start of the
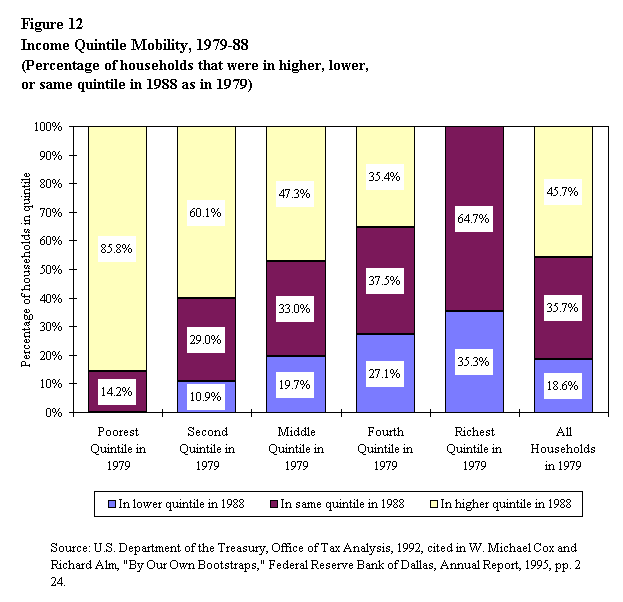
decade to the end are examined. Figure 12 shows that 86 percent of
households that were in the poorest income quintile in 1980 had moved up
the economic ladder to a higher income quintile by 1990. Incredibly, a
poor household in 1980 was more likely to have moved all the way up to the
richest income quintile by 1990 (15 percent) than to still be in the
poorest quintile (14 percent).
Fable 11: The Poor and Minorities Lost Ground under Reagan's Economic Policies
The 1980s was the first decade since the 1930s in which large numbers of Americans actually suffered a serious decline in living standard. [51]
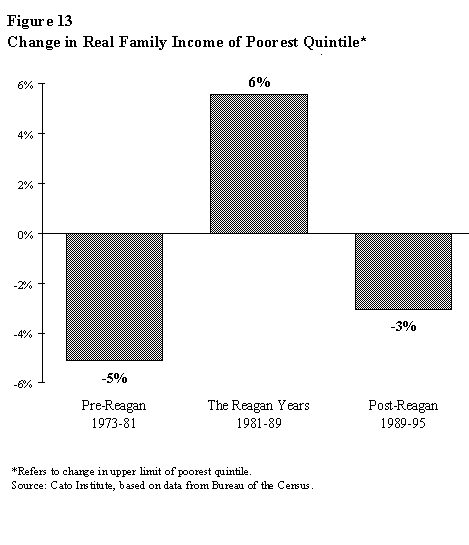
The poorest 20 percent of Americans experienced a 6 percent gain in real income in the 1980s and have suffered a 3 percent loss in income in the 1990s. Figure 13, which compares the income trends for the poorest fifth of Americans over the past 20 years, shows that the poor did the best during the Reagan years. Black Americans saw their incomes grow at a slightly faster pace (11.0%) than whites (9.8%) in the Reagan years (see Table 9).
| Table 9 Real Household Incomes | |||
| 1973-81 | 1981-88 | 1988-94 | |
| Whites | -2.2% | 9.8% | -3.8% |
| Blacks | -4.4% | 11.0% | 2.0% |
Source: Bureau of the Census, "Money Income and Poverty Status in the United States, 1995," Current Population Reports (Washington, D.C.: Bureau of the Census, 1995).
Fable 12: The Rich Saw Their Tax Bills Go Down in the 1980s While Everyone Else Paid More
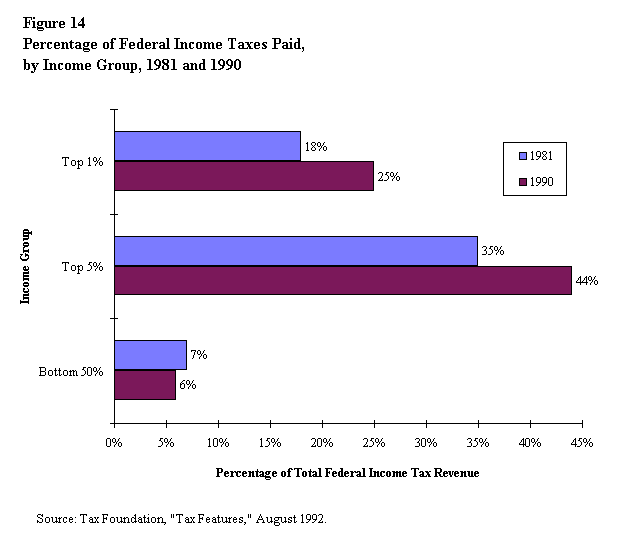
Contrary to popular rhetoric, the wealthiest Americans did not pay less taxes; rather, they paid more taxes after the income tax rate cuts in 1981. In constant dollars, the richest 10 percent of Americans paid $177 billion in federal income taxes in 1980 but paid $237 billion in 1988. The remaining 90 percent of households paid $5 billion less in income taxes over this period. [52] They earned more and they paid more. In fact, Federal Reserve Board member Lawrence Lindsey has shown that taxes paid by the wealthy were substantially higher than they would have been if the top tax rate had remained at 70 percent.[53] Figure 14 shows that the share of total income taxes paid by the wealthiest 1 percent of all Americans actually rose from 18 percent in 1981 to 25 percent in 1990. The wealthiest 5 percent of Americans saw their tax share rise from 35 to 44 percent. So the rise in the deficit was clearly not a result of "tax cuts for the rich."
Conclusion
The 1980s were years of economic progress, not decline. Real GDP grew by about one-third in the 1980s. The economic gains were widely distributed among income groups, with every income quintile, from the richest fifth to the poorest fifth, gaining ground in the Reagan years.
The Reagan tax cuts were not a primary cause
of the eruption of the deficit in the 1980s. The main two causes were an unexpectedly sharp reduction in inflation in the early 1980s that led to large real increases in federal spending, and a nearly $1 trillion military build-up during the last phase of the cold war.
Most significantly, the economy of the 1980s outperformed that of the 1990s in virtually every measurable category. Economic growth was higher, job creation was faster, incomes rose much faster, and productivity climbed at a healthier pace.
[1]. The Economic Recovery and Tax Act of 1981 (the Kemp-Roth tax bill) reduced income tax rates by 25 percent over three years.
[2]. White House Press Release, Office of the Press Secretary, August 5, 1996. Remarks by the President at signing ceremony for Iran-Libya Sanctions Act of 1996.
[3]. See, for example, Donald Barlett and James B. Steele, America: What Went Wrong? (Kansas City, Mo.: Universal Press Syndicate, 1992), p. 3. The authors argue that "In the 1980s the already rich got richer than ever . . . while life for the working class deteriorated, and those at the bottom were trapped."
[4]. See, for example, "Promises Made, Promises Kept," White House Office of Public Affairs, December 1988.
[5]. For a detailed description of the economic policies of the Reagan administration, see William Niskanen, Reaganomics: An Insider's Account (New York: Oxford University Press, 1988).
[6]. For a good summary of the economy's performance during the expansion years 1983-89, see Robert Bartley, The Seven Fat Years: And How to Do It Again (New York: Free Press, 1992), p. 2.
[7]. See Bill Clinton's 1992 "Putting People First," campaign document Democratic National Committee, Washington, D.C.: August 1992.
[8]. Stephen Moore, "Broken Promises: What's Gone Wrong with the Economy of the 1990s?" Report no. 136 (Lewisville, Texas: Institute for Policy Innovation, April 1996).
[9]. Most of the economic data are only available through 1995. Where we have more recent data that include preliminary estimates for 1996, we include them.
[10]. Actually, the lame-duck Reagan administration released a fiscal 1990 budget in early January 1989, but the Bush administration mostly ignored it.
[11]. To account for the fact that the 1990-95 period is shorter than the eight Reagan and eight pre-Reagan years, all the economic variables are shown on an average annual basis.
[12]. On the no-policy-lag basis, however, productivity growth was highest in the Reagan years.
[13]. Richard McKenzie argues that this expansion was the equivalent of adding another California to the American economy. See Richard B. McKenzie, What Went Right in the Nineteen Eighties (San Francisco: Pacific Research Institute for Public Policy, 1993) p. 121.
[14]. Chris Frenze, "Reagan Income Growth versus Clinton Crunch," Joint Economic Committee of Congress, March 1996. Based on U.S. Census Budget Data.
[15]. Alan Reynolds, "The Seven Lean Years," Hudson Institute Policy Report (Indianapolis, Ind.: Hudson Institute, 1996.)
[16]. Net national investment in the 1980s showed a similar pattern to that of savings: the net investment rate fell from 10.5 percent in the 1960s to 5.3 percent in the 1980s to an all-time low of 3.8 percent in the 1990s. Yet, according to the Department of Commerce's Bureau of Economic Analysis, net foreign investment in the United States exploded from -$31 billion in 1980 to a high of $115 billion in 1987. Over the course of the Reagan years, net foreign investment in the United States increased by nearly one-half trillion dollars. In the global marketplace, lower tax rates tend to attract capital because the after-tax rate of return on capital investment rises as the tax rates fall.
[17]. H. Erich Heinemann, "Dead on Arrival Autopsy Report," Washington Times, April 4, 1996, p. A15.
[18]. Arthur B. Laffer, "Les Hauts Taux Les Totaux," A.B. Laffer, V.A. Canto and Associates, San Diego, Calif., March 25, 1996.
[19]. CBO Budget and Economic Update, August 1996.
[20]. Congressional Budget Office, "Economic and Budget Outlook," December 1990.
[21]. Historical Tables, Budget of the U.S. Government, Fiscal Year 1997.
[22]. Ibid.
[23]. Lawrence Chimerine, chief economist at the Economic Strategies Institute, "Return of the Supply-Siders," Washington Post, July 23, 1996, p. A24.
[24]. Office of the President, "America's New Beginning: A Program for Economic Recovery," February 18, 1981, p. 16.
[25]. Economic Report of the President, 1996
[26]. This is not to argue against the wisdom of a defense build-up in the early 1980s. Even the Carter administration had called for large defense spending hikes in its last budget. Reagan increased defense spending faster than Carter would have, but some large increase in military spending was no doubt inevitable given the geopolitical situation in 1980 and the almost universally acknowledged inadequacy of America's military in those years.
[27]. David Stockman, The Triumph of Politics: The Inside Story of the Reagan Revolution (New York: Avon Books, 1987).
[28]. Paul Craig Roberts, The Supply Side Revolution (Cambridge, Mass.: Harvard University Press, 1984).
[29]. New Republic editorial, September 9, 1985, p. 7.
[30]. See Stephen Moore, "Clinton's Dismal Scientists,"
National Review, March 15, 1993, pp. 32-39.
[31]. Paul Samuelson, cited in Moore, "Clinton's Dismal Scientists," p. 34.
[32]. Hobart Rowen, cited in ibid., p. 36.
[33]. James Tobin, cited in ibid., p. 34.
[34]. Walter Heller, cited in ibid., p. 35.
[35]. Paul Krugman and Larry Summers, "Inflation during the 1983 Recovery," U.S. Government Memorandum, September 9, 1982. Significantly, Summers and Krugman are two of the most vocal opponents of the Dole tax cut proposal.
[36]. Stephen Moore, "Clinton's Dismal Scientists," National Review, March 15, 1993, p. 38.
[37]. Stephen Moore, "Doomsday Delayed: America's Surprisingly Bright Natural Resource Future," Report no. 118 (Lewisville, Texas: Institute for Policy Innovation, August 1992),
pp. 47-50.
[38]. Bill Clinton, August 17, 1996.
[39]. Newsday editorial page, November 15, 1988.
[40]. The current economic expansion is in its sixth year and may eventually exceed the Reagan recovery.
[41]. Robert Kuttner, Los Angeles Times, October 14, 1991.
[42]. Congressional Budget Office, "Economic and Budget Outlook," January 1989.
[43]. What is unique about the big deficits in the 1990s is that, unlike the very high deficits of the Reagan years, which corresponded with high and growing cold war expenditures, the Bush-Clinton deficits have occurred despite a shrinking defense budget. Normally at the end of a war period, the deficit falls sharply or even turns into a surplus as wartime expenditures fall. But as discussed earlier, under the Bush-Clinton administrations, reductions in wartime expenditures have given way to large increases in the budgets of most all other civilian programs.
[44]. Barlett and Steele, p. 2.
[45]. The best discussion of this issue is found in McKenzie, What Went Right, or see Richard McKenzie, "America: What Went Right," Cato Institute Policy Analysis no. 172, June 1, 1992.
[46]. McKenzie, What Went Right, p. 232. McKenzie argues that these percentages probably understate the total amount of wage supplements provided to workers.
[47]. Ibid.
[48]. Kevin Phillips, The Politics of Rich and Poor: Wealth and the American Electorate in the Reagan Aftermath (New York: Harper Perennial, 1991), p. 52.
[49]. Bruce Bartlett, "Trickle-Down Economics," National Review, September 2, 1996, p. 63.
[50]. Bureau of the Census, Income Statistics Branch, Current Population Reports, Series P60 (Washington, D.C.: Bureau of the Census, 1996).
[51]. Paul R. Krugman, The Age of Diminished Expectations: U.S. Economic Policy in the 1990s (Cambridge, Mass.: MIT Press, 1990), p. 22.
[52]. Lawrence Lindsey, The Growth Experiment: How the New Tax Policy Is Transforming the U.S. Economy (New York: Basic Books, 1991).
[53]. Ibid.
© 1996 The Cato
Institute
Please send comments to webmaster
![]() Send this
page to a friend
Send this
page to a friend ![]() Printer
Friendly Version
Printer
Friendly Version
1000 Massachusetts Avenue, N.W. Washington D.C.
20001-5403
Phone (202) 842-0200 Fax (202) 842-3490
All Rights
Reserved © 2003 Cato Institute
|
|||
|
||||||||||||||||||||||||||||||
|
|